Designing and data are two halves of the equation
- Design helps improve data quality and experiments with users
- Data helps defend design decisions, creates metrics and measure effects towards goals
Design doesn’t come just from instincts alone
The reason designers fear data:
- Data undermines and undervalues the designer’s intuition and experience
- Data stifles creativity and removes the “art” from the design process
- Data dehumanizes the design process, reducing human experience and design evaluation to “just numbers”
- Data overemphasizes minutiae and optimization of small variations in the design
- Data enslaves you—believing in data as way to evaluate designs takes the power away from design as a practice
Design brings deeper meaning to data and design practice can be enhanced by data
Three principles (of why Design needs to be combined with data)
- Design advocates and is accountable to users
- Design needs to be invested in representing users accurately and appropriately. This requires drive for understanding user and user behaviors
- A design perspective ensures that user experience is are appropriately measured and represented with metrics and goals
Chapter 1
Data is all around us now us, we just need to interpret it
There are three ways to think about data
- Data-driven design means all of your decisions are driven entirely by data
- This is useful if you know exactly what your problem is what your goal is and you have an unambiguous question that you want to understand
- it also seems that your methodology and measurements are sound
- If it’s not a cut-and-dried case you might want to do data inform design
- The team takes data as one input in their decision-making process.
- Data is a way to inform the problem and the problem space because as you’re iterating on the problem space and what the goals are you may begin to see the solution
- The next level up is data aware design
- This is when you use design this is where you make design decisions to the Collection process and how you are creating a data collection system
- You’re aware that many types of problems and many kinds of data are available to you until you’re trying to figure out what’s the best way of approaching your goal
To give an example
- Data-driven process is like you’re waiting at a train station for a train it’s going to a specific destination
- Data informed process is eyou’re at the railroad station and then many different trains on different tracks, all could take you somewhere to specific process
- Data-aware process is when you’re just thinking about transportation in general
- whether you go by train or bus or car different types of problems and many different types of methods that you could possibly use
In Data-aware design data is a creative process
- it’s the primary decision-making tool only when the data has been well designed and proven to fit the purpose of the goal
- Need to design the data capture analysis and questions as part of your design process
Having common success metrics within your company can help designers and product align on a common goals target users
Also show potential impact of design towards Meeting those goals
To make sure that data quality is great you want to engage with the following questions
- Relevance (Are we asking the right questions)
- Appropriateness (Does it answer our questions)
- Data reliability (Did lose something in this data collection? Is the data reliable? Did we bias the data?)
- Would different data or different analysis be more appropriate? Are we doing what is convenient rather than what is right?
Design is not art or doesn’t exist for design sake
- Design is problem solving so you need to know whether or not you’ve actually solve the problem
Data producers
- Data analyst and scientists
- Researchers
- Designers for generating the data on or generating that the design of data collection can be very very helpful
- Also marketers are a good source of information about users demographics and Target audiences
Data consumers
- Business or product managers that look at data to get stronger insights on how the business is performing
- Engineers need to see how design should be built and tracking and capturing the data
Making data friends especially with data producers can help you immensely
Working with data is a creative process
- Triangulation between multiple source of data tends to give you a more complete picture of your users
- You need to work with others to be successful you don’t need to be an expert in data
Some questions to ask
- Who is producing and consuming data in your company
- Is your company data-driven data-informed or data aware?
- What kind of data does your company use
- Who’s in charge of experiments
- What’s the designer’s role in producing data
- Are there data gaps
- What questions would you like to ask her users
- Who do you currently work that can help you on your quest to integrate data into your design process?
Chapter 2
There is no one best type of data
- The best data is just the data is the most helpful and relevant information about the topic you have in mind
The many dimensions of data can be summed up:
- Why are you collecting data
- when are you collecting data
- How are you collecting data and
- How much data are you collecting
The why of collecting data can be broken down into the behavioral versus attitudinal question dimensions
The when is that data collected is either a longitudinal (long-term view) over a long period of time or a snapshot
The how is the data collected is broken down into quantitative versus qualitative data
The how much is basically about the quantity.
- 5 users can result in seeing 85% of the usability issues
- However if you’re collecting from a large sample of research you can get more precise quantity and frequency information
- how often users will take certain actions or how many peoples feel certain ways
Causality is an important concept to understand because controlling for factors is important
- You may think that advertising in a magazine may increase enrollment in your camp
- They could also be the economy is going well so you can afford to advertise in magazines and people have more ability to go to camps
That’s why experimentation is very important to eliminate causality IE limit the number of variables are factors that might be a cause
Qualitative research seeks to do this by limiting anecdotal evidence by designing rigorous unbiased questions
Quantitative research seeks to use statistical significance statistical methods such as p-values and standard deviations.
Statistical significance doesn’t tell me whether something is right or wrong it just suggesting me that something interesting is going on
- Basically signs hey maybe you should pay attention to this
The basics of experimentation are very simple: there’s a change an observation and a control
For example, if you substitute egg whites for eggs when making a brownie recipe:
- Change is eggwhites in brownies
- Control is eggs in brownies
- Observation is the difference in rate of consumption or comments on taste
The independent variable (i.e. the change) is the variable that you change in order to observe a change in the dependent variable.
Confounds are issues in your experiment that can sometimes lead to confusion as to what caused the difference in the dependent variable.
If one group had hiking boots in addition to all the other things that you presented, that might bias the outcome.
Experimentation has been around for a long time but digital age allows us to collect large amounts of data about our users quickly and cheaply
Another name for experimental and control groups is test cells.
Cohort is a group of users who have a shared experience so far example in the same year
A segment is when you manually what your user base into different groups based on certain demographic factors behaviors basically splitting up the group according to your choosing
Demographic information is often things like
- Behavior
- Technology
- Expertise
- Other things such as age gender race disability
Another thing to consider is the difference between existing and new users
- if you have to think about the concept of memorability, existing users have prior experience they come in with a preconceived notion of how your service or product works
- This is called The Learning effect
The three considerations for your test samples:
- What cohorts are segments do you want to represent in your findings
- Considerations are relevant
- Are you interested in learning about new or existing users
Metrics are often the dependent variable in testing especially in things such as a b testing
- A measure is anything you can observe capture and count
- A metric is a predetermined and evaluative benchmark has been determined to have some business value
Success tell your can be determined by key metrics and the focus of your business medmetrics you would like to see improve oftentimes the success or failure of a design is defined by these
If you can’t discern any effect on key metrics easily (such as with the case of Coursera and their 13-week courses):
you can use things such as proxy metrics
- In the case of Coursera these were things such as do people get through the first test or do they engage with a course two or three different times on different days
Things that you want to consider as you’re considering these metrics are
- What kind of business are you
- What is your revenue model and
- How mature is your business
Interesting key metrics even outside of normal testing
- Active user AU
- Daily active users DAU and
- monthly active users Mau
Measurement design is subjective someone decides what to measure how to measure it and how to build the model so all data is subject to human bias
Power is the probability that you can correctly detect a statistically significant result there is a real difference between your experimental and control groups
- This is essential in being able to determine that you have a difference between the two experimental and control groups
Next you wanted to find how big the difference is that you want to measure
- We have something called the minimal detectable effort the minimal detectable effect mde
- Basically what this is is what is the minimum difference we want to see between our testing and control to determine whether or not an A/B test is a success
Calculating not only these the power but also the mde there is a big enough sample to power your test
Larger sample sizes are more believable because 40 kids beating 120 kids would be more compelling evidence than one kid beating out the Greenie
A p-value is basically how many probability is it that this was just due to random chance versus your hypothesis
With all this packing now we can actually create a hypothesis
- the reason why this is matters is it’s a quick method of getting the rest of your team to get on board to take responsibility for defining what you want to test and what you want to work towards
Remember that you can’t prove a hypothesis you can only make it so that ready that it can’t be disproven
The hypothesis usually takes out as a form of
- if we do X the users will do Y because of Z and that will impact the metrics A
Also very likely that you will have multiple hypotheses I’m so one might be about navigation or one might be about food
- if we’re going by the camping example when you can set up multiple tests cells that has multiple hypotheses at once
You should learn to aim to have two things when crafting hypothesis statement
- capturing the essence of the changes you propose to make your understanding in
- A plan that addresses what you would learn by testing the hypothesis
In terms of knowing what you want to learn you should aim to answer these questions
- if you fail what do you learn that you apply to Future designs
- If you succeed what will you learn that will apply to Future designs
- And how much work are you going to put into testing in order to get to this learning
One of the pitfalls that many teams fall into is only having one aspect so if you succeed then you’ll learn a lot but if you fail then and I’ll just forget about it
- seek to learn even if you fail because that’s how you become data aware
A/B testing is not just a way to validate Your Design before shipping
- Using a b testing and other data methodologies can help you become creative in the design process
This also allows you to use data triangulation which is using mixed methods to cover for the weaknesses of specific testing method
Remember A/B testing has a weakness in that it doesn’t tell you why something happens
Figure out whether the problem exploratory or explanatory
- Explanatory problems show how close you are to finishing the work
- Exploration helps you to figure out what to build next
- Both evaluation helps measure the causality of your work
Exploration couldn’t have a specific solution in mind instead you’re just figuring out what happens to the metrics if I do this or how am I users respond to this change
The evaluation stage you’re very likely looking for specific answers such as:
- Can my users complete their goals with this design or
- Did I just observe any drops to my metrics when implementing this design
2nd Dimension you want to think about is either Global or local
- when you’re designing for a local problem you’re focused on a specific solution and you’re making small changes to one or two pieces in order to understand the importance in isolation
- so think of the Train on the train tracks you can either switch to one track and go one way or another track
- in another sense these may be things such as the placement color size or copy of the buttons
Local problems also usually are less pronounced involved shorter time scales and the most appropriate when your existing solution is performing adequately
In contrast when you’re solving a global problem this is more of the data aware design where you’re thinking about possible different ways of transportation to get from point A to point B
- This is often when you’re completely redesigning an existing experience because it’s performing poorly because it’s outdated or you’re just looking to make a lot of large changes
- You’re taking more time to land on the best solution because you’re changing multiple factors at once
An examples for these concepts is mountains in a mountain range
- Local Maxima is picking a specific mountain and perhaps optimizing it so that you’re able to get to the top of the mountain, but unless you’ve explored the surrounding mountain ranges you don’t know if that one specific mountain is the tallest mountain of all
- Global maxima is looking at all the mountain ranges before scaling one to get to the best possible solution with highest elevation, takes longer but can be necessary if current mountain top is poor performing
- What kinds of questions to ask
- What types of data have you used in the past
- and what types of data have you not tried but might apply to your work
- how many users does your company have in
- could you use a small sample research to learn more about them or large sample research
- do you have any instances where people have used anecdotes to make design decisions may have change of those designed to sit in for dress with experiment
- have you come across a situation for a correlation with mistaken for causation
- how might you have established causation with confidence
- are there examples of human activities that you’ve studied that have changed since becoming digital
- can you think of ways in which the changes opened up broader sending or deeper understanding through experimentation
- does your company currently run a A/B Test
- who owns these experiments
- what is the role of the designer been for this
- what other methods does your company use to understand its users other opportunities to triangulate those methods with a B testing data
- what’s the size of your study that you would like to conduct here
- have recently caught conducted and help with your independent and dependent variable
- can you think of instances for a small changes how to Major Impact on the way that you or users you soon application
- think of global change you made recently such as a product redesign
Chapter 3
Tuesday, September 8, 2020
7:45 AM
What’s the relationship between UX, Design, and Data? There should be no divide between data and design insight.
Remember testing has a weakness in that it doesn’t tell you why something happens
Figure out whether the problem exploratory or value on Tori puppy show how close you are to finishing the work exploration helps you to figure out what to build next all valuation helps measure the causality of your work
Exploration couldn’t have a specific solution in mind instead you’re just figuring out what happens to the mattress if I do this or how am I users respond to this change and the evaluation stage you’re very likely looking for specific answers such as can my users complete their goals with this design or did I just observe any drops to my metrics when implementing this design
2nd Dimension you want to think about is either Global or local when you’re designing for a local problem you’re focused on a specific solution and you’re making small changes to one or two pieces in order to understand the importance in isolation so think of the Train on the train tracks you can either switch to one track and go one way or another track in another these May thing be things such as the placement color size or copy of the buttons
Local problems also usually are less pronounced involved shorter time scales and the most appropriate when your existing solution is performing adequately
In contrast when you’re solving a global problem this is more of the data aware design where you’re thinking about possible different ways of transportation to get from point A to point B this is often when you’re completely redesigning an existing experience because it’s performing poorly because it’s outdated or you’re just looking to make a lot of large changes am I taking more time to land on the best solution because you’re changing multiple factors at once
Atlanta to these Concepts is the idea of global and local Maxima so what’s way to think about this is the local Maxima maybe optimizing it so that you’re able to get to the hollis New mountain top of a specific Mountain unless you’ve explored the surrounding mountain ranges you don’t know if that one specific mountain is the tallest mountain of all global maximum so it’s either optimizing small changes in order to get to the big the biggest evaluation of your current experience or sort of like that mountain and explain the surrounding mountain range to find if there’s a better solution with a higher possibility
What kinds of questions to ask what types of data have I used in a pound have you used in the past and what types of data have you not tried but might apply to your work how many users does your company have in could use a small sample research to learn more about them or large sample research do you have any instances where people have used anecdotes to make design decisions may have change of those designed to sit in for dress with experiment 610 have you come across a situation for a correlation with mistaken for causation how might you have established causation with confidence are there examples of human activities that you’ve studied that have changed since becoming digital can you think of ways in which the changes opened up broader sending or deeper understanding through experimentation does your company currently run a T Test who owns these experiments what is the role of the designer been for this what other methods does your company use to understand its users other opportunities to triangulate those methods with a B testing data what are the what’s the size of your study that you would like to conduct her have recently caught conducted and help with your independent and dependent variable vane can you think of instances for a small changes how to Major Impact on the way that you or users you soon application think of global change you made recently such as a product redesign
Chapter 4
Thursday, September 10, 2020
2:01 PM
How can you go abroad by generating as many hypotheses as possible then after that narrowing down to one or two hypotheses to focus on
Making sure that you have a clear goal is what you should focus your energy on where do you want to spend your time and efforts making an impact and why do you believe it’s good for you users
Also what are the business critical and user critical issues that get construed in your company as opportunities or is problems and issues and where are the biggest opportunities for you to improve upon your user experience
Often times our goal will have both qualitative and quantitative components so don’t worry about classifying your goal as qualitative or quantitative
Uniquely tied to your goal is your metric of interest that tracks your progress towards these goals when did designers here about metrics they often too worried that they’ll become the slave to those metrics and lose the ability to create be creative however singular metric of interest that you and your team can rally around is going to help so that you have something to strive for how you change that goal is up to you
And this is again for proxy metrics such as test completion for Coursera we used to anticipate one of the key metrics which is critical completion open times for your key metrics there might have to be additional tests or additional research that needs to be done cuz if your key metric is example of Abandonment maybe you don’t know what happened after they stop using the page have to conduct an interview
In addition you might have to think about metric sensitivity so sensitivity refers to how much a changing experience that it takes to cause a change in the metric to give an example net promoter score is often used to gauge a customer’s overall satisfaction but it’s a very insensitive metric that usually is on a scale from 1-10 so going from a 7 to an 8 off and requires a lot of the change of experience
So this is a metric of interest for your experience is very important to avoid bias
The other thing you need to consider is if your key metrics are very large or it’s a very long-term game that’s result of smaller changes you may have to track several metrics and see the success of that to determine any changes in key metrics this is where the use of secondary methods comes into play so if your metric of interest is increasing your time on site to pay attention to secondary metrics such as are social recommendations are better contact personalization but that also make sure that there is no abandonment issues where someone spending a lot of time out there but it turns out they’re not doing anything it’s very clear that you have to pay attention to what is the key metric it or metric of interest and what is the secondary metric if your secondary metric improved at the cost of your key metric that is not necessarily A change that he wants implements
As you’re thinking about what metrics to Cheeseburger goal you want to think of a few questions for sure to ask everyone who is working on the project but the desired outcome is what would they say be sure to ask your colleagues how they expect to measure the outcome if you were are you all in agreement how are your metrics of Interest related to company goals are you focused on affecting metrics that will have meaningful effect on your business so observing secondary metrics what can you learn from them that you won’t see in your metric of Interest I am metrics that you’re targeting sufficiently ambitious or are they too ambitious and the last week can you effectively measure a change in your metric within the time frame of your projects are there proxy electrics you can use instead
The other thing to keep in mind is that your metrics may change over time when Stitch fix went from an automatic on demand service to 10 to a subscription service model the metrics needed to change as a result initially they were concerned with how many transactions were being made so you can see how many things are purchased for however shifted to a subscription service then it was all about the retention and taking that long-term view to see which customers continue to purchase things from order to order
And it’s a shame sometimes you might have been feeding metrics so if one team wanted to work on efficiency and one wanted to work on customer training sometimes those things were at odds and so it’s very useful to bouncy mattress to deliver the best experience having members of both teams that are working on different metrics working together is a great way to find that balance so that one metric doesn’t lose out over the other
No one last thing that you can remember is you should refined your goals with data remember a goal your initial goal is coming in at the beginning of the project when you may not have the data required to analyze certain things or figure things out continue want to take stock of everything you know about your experience currently and are people getting stuck in certain places or people voicing certain frustrations at the results you want to be as broad as possible about your definition of data it is not just interviews or surveys it can be pennywise cerveza can be tools and users that you’ve never talked to it could be different departments that you didn’t include within your original scope and because our gathering data from all these different sources you have to think about your data quality so if you’re looking at a specific data source you should think about who or what does that day to represent suffolk segment of your user base or does it come from a sample of uses that represent the entire user base they give an example tweets may only indicate the happiest or angriest of customers people in the middle of the road that were like those pretty good may not tweet about it at all other thing to keep in mind is is accurate hasn’t been vetted for quality or interpreted at a point also what dimensions did does the date of fall pacific strength are limitations of that type of data so maybe you should have looked at that to try and determine why use they’re doing something last night was it collected recently enough to still apply to your company and business landscape today
What does summarize here’s the the questions that you need to think about so what kind of day did you have current you currently have access to that might give you Insight on way to make the most impact forms of data provide insight into where there is opportunity to improve performance some of your most engaged users doing and how do you encourage other uses to do the same do they do what they do and how does that behavior make them more likely to continue using your product and service what do users who are most likely to convert do what actions did they take what are your users biggest pain points pinpoint across segments of the air user population what types of complaints do you hear from customer service departments are through past user research
First identify the problem that you’re in solving so as you started thinking about a goal I think about how you going to approach a cheating app through the analysis of your Data Insights you should be able to identify areas where there problems that can be improved upon or opportunities to innovate towards our goal and for each of those problems we can form a problem statement that actually the further two measurable criteria usually the metric of Interest in order to measure progress towards our goal so in this way you want to think about what are the biggest problems your user stands that are impeding your goals users consistently have trouble and what are their biggest complaints are the what are the biggest opportunities for you to improve that expenses what are your power users who quickly adopting use your most advanced features doing give you Clues to possible opportunities
Identifying a few problem or opportunity areas is the beginning and crafting your hypothesis and looking at data and unexpected ways can often identify new designer business opportunities and then example you might look like at outliers in data to see what they’re doing or why they’re buying the things that they’re doing look at certain habits such as people who were into list-making either on Post-its or index cards because that was an indication that they were more likely to purchase something but don’t jump you pour too quickly into problem-solving mode this is just the problem or opportunity areas section first where you’re trying to stand that right level of thinking of understanding what the problem is before trying to solve it metrics help you measure not only your success towards our goal but whether your efforts are worth it because you always have to prioritize forces that there’s going to be limitations it’s impossible to chase every idea that experimental mindset when you’re looking for problem areas or opportunities you can try and find things that are going to pay off a larger metric increases
How do you actually build a hypothesis while there’s a model a model for constructing a strong hypothesis is for music groups if I change sucks because rationale which well impact measure
Here are a few questions to get started thinking about User Group what do you know about them as a demographic what are their habits are you targeting these users in relation to your business what relationship do they have with your company are these existing users new users a power users
Then you’ll need to do something different to impact the user groups think about that change component are you introducing something completely new to the experience are you removing something or are you changing something about the current experience
When you’re talking about the effect your explicitly articulating the desired behavior that you want so address that question what was the problem that you identified and what use are behaviors can minimize our address this problem the opportunity are you identified incentivize behaviors that make this opportunity of reality what are your power users doing
Guns thinking about the rationale is what evidence are you Gathering that would indicated users are actually making this change or supporting your hypothesis does this rationale speaker covers customers motivations or lever to tactic or mechanism to make that change and what kind of data have you seen to support this hypothesis and how consistent is it
Leslie the measure is the metric or metrics that you’re trying to impact so I think about that which metrics are you going to look at to understand if the impact you’re making is the right one or big enough how are these metrics related to the goal that you’ve already defined in your business goals would you measure or factor in either sentiment and if so how are you going to use things such as surveys or focus groups and interviews
The hypothesis might not always take that format is another hypothesis format that works we predict that doing this building this feature or creating this experience people are personas will achieve these outcomes because of these reasons I know this is true when we see the impact to our metric of Interest
As you consider these hypotheses for your business question such as are there any emerging trends that could inform affect or change your customers behavior in a way that you’re not considering now do they match the users that you’d like to have in the future are they similar or different from each other what are some of the gaps in your product service or experience that you can sell who are the competitors are other companies in the space that are doing this if there are other people there are you doing that can be successful but different from this experience
One thing to remember is that you’re still in the Explorer or Discovery part of the process specifically thinking like the design the Double Diamond or the design thinking model the result you want to think broadly with your hypotheses reading multiple hypotheses are great way of outlining multiple problem opportunities that you can brainstorm how you can address multiple problems with one single research method you might have also seen multiple ways to influence a metric so for example if was purely Revenue you could get more customers you can get existing customers to pay more you could reduce the churn or a number of different things brainstorming a list of all possible desired behaviors that might impact your goal and with these there might be a different hypothesis that you might want this you could focus on new users or you could focus on new and existing users example like broadening your user base by charging users or providing a better experience for those existing system users you can also revisit the scope of your problems so if you are thinking of a purely local problems such as changing the color of a button from Blue to Red in order to increase for signups maybe there’s other actions you could take on the global level that would also increase your customer conversion rate
Looks like you want to involve your team and your data friends so if you’re working with product managers they might have unique insights into business or she cuticles anyone that works on your team with data such as user researchers or data analysts make knowledge about your users and then your engineering Partners can help you understand the difference engineering impact of trying to implement different hypotheses
Determine which hypothesis to use after you’ve come up with multiple hypotheses you want to consider the potential impact in order to increase conversion for example you could the landing page of your website or e-mail people that give up in the middle of purchases one of these might just have a much bigger potential impact businesses and so think about the order of magnitude of impact You’re Expecting and then the other thing is using what you know based on talks with different people data friends to ask them for the questions have we conducted research about any similar hypotheses or similar users or user groups changes alert desired Behavior similar rationales and how many how have these types of hypotheses Port performed in the past changes have successfully Implement impacted this metric in the past so in order to prioritize our hypotheses you want to consider additional questions such as what has possibly research found or have there been surprising results in other research
Wesley there may be other methods of evaluating a hypotheses low Fidelity inbox or paper prototyping might be another way or other methodologies such as card sorting last I remember how much measurable impact do you believe that your hypothesis can make we talked earlier about the minimum detectable effect this is the minimum change you need to see in order to see a change what statistical significance the last lie can you draw all the conclusions you want to draw from your chest
Just like your failures how to keep all hypotheses in your back pocket because maybe at another point in time you want to consider it but it’s in this way that you can start to narrow down your types of hypotheses in
It is a very common mistake for Kingston to quickly pass this first stage and clearly articulating what it is that they’re trying to accomplish because some the building implementing designing if you spell out the problem and not just in problem solving mode but the problem then you’re going to be able to focus on the right things rather than the wrong things
Chapter 5
Thursday, September 10, 2020
2:26 PM
We want to emphasize not to jump too quickly and too narrow and specific Solutions hastily moving on to premature Solutions is common problem with encounter time and time again in the design process it’s kind of a natural tendency for us all between traffic timelines and eager to dive into the problem and get working on it it’s easy to want to start as quickly as possible something to keep in mind is that while we separated hypothesis generation and designing your hypothesis into two separate chapters in The Book Thief please go hand in hands
Testing your ideas on a smoke Depot with users means you’re able to try Boulder and more ranging the design Solutions because you don’t have to be confident about being right in the same way if you are to ship the solution to everyone and have only one chance to do it we recognize that for designers who haven’t worked with Data before there cultural challenges of incorporating data and a b testing your product development process culturally is that a focus on brand you want to put your best friend for it and generally that means you are the editor and curator of what you think is best the girlfriend toohey we decided to sign some stuff and put it out there on the end up launching whatever wants fast
When designing to learn we want to convey to important points first that you approach Your Design work with the mindset of trying to understand how your craft will impact customers Behavior rather than focusing on chipping a final product to experience italy your designs need to be effective representations of the ideas that you want to test with users a good way to a purchases start by considering the difference between writing a book and having a conversation at 1 in the book is static once you have written it down onto the page it’s often times very hard to get or answer questions like that so focus on spotlighting certain things however if they were to talk with you then you could either correct things or clarify based on specific preferences things like that so it’s very different
Quick and frequent conversations will I you get feedback until your ideas from the campers and the conversation is a great metaphor for how we see working with data ideally you’re trying to build this long-term relationship with their customers and both data and design can copy how those conversations with them the data is the response to the question does this work for you
However if you’re going to run with the analogy of conversations sometimes you get the best quality conversations if you were to ask should I do a or b the way of phrasing things that my cat use certain answer but you were to ask it in a more broad sense where it’s like what are some of the activities that you would enjoy sometimes you’re going to get back a wider array of things you may even want to design to extremes to learn about users rather than trying to design for the average design for one extreme or the other so for example if you’re trying to build customer retention or a long-term thing perhaps you could even think about getting rid of things like an automatic return policy because each box that you said that to your customer is a way of the company to interact with a customer if they were to ship back things group together but they didn’t like rather than individual items you might be able to learn a lot more about how certain Styles R-rated are grouped together
And in terms of revisiting the minimal detectable effect you want to make sure that the changes that you’re proposing are actually going to be able to for example change the net promoter score from 7 to 8 or have some set of otherwise measurable effect for that reason something as simple as hey we should change your background color may not be the strongest hypothesis because may not have potential and quantifiable impact
As a result do you want to ask you coming up with your hypothesis designed the best representation of that hypothesis is hypothesis might have several different ways that you could represent it so for example to go back to an earlier example if you’re trying to increase Revenue then perhaps one of the hypotheses is changes that you make for existing customers will also pack a new users
And once you’re able to slim down your hypothesis you can understand what the variables are that you can play around with it test the hypothesis self example if you want to like Netflix offer more choice in the selection of movies and TV shows you could add a waterslide in the movies in each category or you could add different genres and categories so the difference between adding more rows and adding more columns
However not all variables are visible so for example if you were to consider something like popularity or something like highest rated I changing that variable may not be immediately as obvious so for example if one of the movies and then number three slot shifted the number one slot because popularity was more rated some things change but they may not you know be able to is Italy qualified enough to make an impact
As a result sometimes companies will metrics that are if not directly visible then indirectly his such as Google prioritizing speed there are tons of studies on people’s perceptions of where if you drove without traffic for 10 minutes she drove with traffic and it’s still so cute 10 minutes but you were blocked in traffic you would is that the truth in traffic time and took longer
And your design can influence your data
So you have to balance between creating the right balance for the overall experience for users cancel might be if you had a very large button that said hey click this huge button then yeah you probably get more sign ups but that the right type of sign up people are just clicking the button because it’s such a huge button but no matter where they clicked on the page and may not be that useful and to think about that more let’s talk about the global and local Maximas again if you remember we talked about exploration and end of the valuation as ways to articulate how far you are in a dressing your problem or opportunity area so are you crafting your specimens just to get a directional feedback on your designs basically is this a better or worse option or are you actually trying to evaluate your design changing only a few variables localizing around a certain maximum so the general rule of thumb is if you’re doing a local Maxima you want designer relations close together because you’re only changing a couple variables where are Global Maxima the design Innovations are farther apart because you may be redesigned the entire site the best best way of approaching these subjects discussed it off with a local Maxima genuine with a global Maxima as your testing whether or not torches work better and then finish with local Maxima
It’s often times risky to do just the global design simply because not only does it take longer but you’re changing so many things that maybe a hard comparison point as a result you always want to try and 10 towards having some local Maxima but you can have the license to think they if you’ve either kicked off a new long-term project caroline on taking more time to investigate a bunch of different directions or anything like that
And if you’re completely starting out new there are certain things that you can do such as fake door or painted door tests just to understand exactly how people are at your side this is basically where you were or highlight certain categories or certain types of information but you would have built the back end it might say this feature coming soon or something very similar to that and so to pick the right level of granularity for your experiment you want to figure out how to optimize not only language but also the stylistic elements and visual representation the types of testing you’re doing with different algorithms for recommendation heavy flows and changes to user pass and other sort of isolated variables because they’re going to be easier to build
So talking about designing the experiences that you’re going to test airport to think about the structure of your test themselves thinking about the specific test designs and thinking about articulating a strong list of things that you hope to learn in both success or failure before you invest in building out the current solution asking if she succeeds or fails what experiment when I run next what is the set of experiences that I would design
Self example if you’re testing out multiple cells if you are testing a different activities at summer camp and there was like kayaking bird watching Studio hearing & Hip Hop Dance if all the tests cells that associated with outdoor activities are performed while you might want to try another experiment the only those types of outdoor activities
Other things to consider when designing to learn one thing that matters a lot of polishing Your Design too much too early and one thing that you can use to sundara address that is considered the 100% launch plan where you consider what would need to be refined or what needs to be updated in order to do a full launch they can see that yeah well there are certain things that are polished there are things here that are still missing such as visual or language polish or refinement of usability things are visual treatments just to make sure that designer ski are presenting something too early too soon is not that not an issue
Chapter 6
Tuesday, September 15, 2020
6:12 AM
How do you vet your designs ahead of launch?
-Surveys, Field tests, Interviews, etc.
How do you design something with Minimal Detectable Effect(MDE) in mind?
-Helps determine design,
–
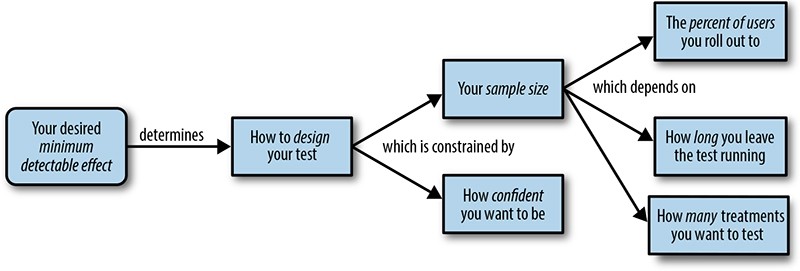
If you’re rolling out changes (i.e. evaluatory design) on a large scale, then your experiment needs a small significance level (.05) which means more samples
-If you’re just evaluating if you’re going in the right direction, then your significance level can be looser (.1) so less samples
Last questions: if you’ve determined you need sample size X, will you recruit more users or let the experiment run longer? How long will it take you to gather your sample size?
Lastly, you can’t always just take the next X of people that come, because of time: if you’re doing all your testing on weekdays, then you don’t get that population of weekend audiences/etc.
-
- This is where things such as A/A testing cna come in very useful.
-
- Are these users that are familiar with your product or are they completely new to your product or service?
- What devices/platforms are they using? Does your product look or perform differently on different platforms? (Android, iOS, browser, etc.)
- How much technical expertise do your users have? Will your future users have similar technical expertise?
For users that are completely new to your experience:
-
- When did they sign up? (Time of day? Day of week?)
- Where did they sign up for it? (From an ad, from search result, etc.?)
- What country are they from? There are cultural differences as well as national standards and legal requirements that may affect the user experience and therefore users’ behaviors.
- Will different types of users use your product in different ways, or with different frequency?
Hypotheses often dictate the terms of the test (for example, testing GPS functionality of app with runners = mobile device)
Is your experience “normal” right now? (If you’re testing but you have a big banner for a limited holiday sale, it may confound test results).
THings to ask yourself:
-
- What am I trying to learn? Do I still believe that my design articulates what I’m trying to learn?
- What will I do if my experiment works or doesn’t work? (Do you have a sense for what your next steps might be?)
- Does my test have a large enough sample size to be powerful at the significance level I want?
- Do you have an understanding of all the variables in your test? (So that when the results do come back you might have some ideas as to what things influenced which changes.)
- Do you have good secondary metrics or additional tracking built into your tests so that you can do deeper analysis if needed?
- Will this data be informative for developing new hypotheses or further experiments?
If you’ve done everything right, then as you launch your test you should:
-
- Understand and know how different factors could influence or be reflected in your results (e.g., audience, platform, etc.)
- Have good secondary metrics or additional tracking built into your tests so that you can do deeper analysis if needed
During the analysis, focus on questions like the following:
-
- What impact did your changes have on your metrics of interest? Was this impact surprising, or did it align with your expectations?
- Did you observe impact to any other key, proxy, or secondary metrics? What was it?
- Are there any results that require further investigation using other techniques?
- What did these results show about your hypotheses?
As you look through the data, you should be able to one of three results: an expected result, an unexpected result, or a flat result.
-An expected result is when you observe a statistically significant result in the direction you expected.
-An unexpected result is when your result is statistically significant but in the opposite direction.
-And finally, a flat result is when the difference you observed is not statistically significant at all.
If you have expected result, that’s good but it doesn’t mean it’s won yet. Consider the following:
-
- How large of an effect will your changes have on users? Will this new experience require any new training or support? Will the new experience slow down the workflow for anyone who has become accustomed to how your current experience is?
- How much work will it take to maintain?
- Did you take any “shortcuts” in the process of running the test that you need to go back and address before your roll it out to a larger audience (e.g., edge cases or fine-tuning details)?
- Are you planning on doing additional testing and if so, what is the time frame you’ve established for that? If you have other large changes that are planned for the future, then you may not want to roll your first positive tests out to users right away.
- Sometimes, you can have an expected result that’s still not worth rolling out. Remember to not follow data blindly: something can be statistically significant but not really that significant.
An unexpected result doesn’t mean to throw it away: it’s still significant. It challenges your team’s assumptions, which is a good thing.
Here are a few questions to get you started:
-
- Are they using the feature the way you think they do?
- Do they care about different things than you think they do?
- Are you focusing on something that only appeals to a small segment of the base but not the majority?
Understanding why you got a negative result will help you decide next steps/why you got that result. There may be negative results that you still want to release. Etsy’s example.
Finally, flat results (most common, 80% of Google’s results can be flat).
There are two ways you can interpret these kinds of results:
-
- Your hypothesis may have merit, but you haven’t found the right expression of it yet (you haven’t gone big enough yet). More formally, it could be that your experiment was under-powered, a true effect exists but you need more power since it’s smaller than you designed the experiment for.
- The hypothesis that you were testing won’t affect the behavior of your users in a large enough way that it changes metrics.
If we revisit some of the factors listed earlier in this chapter, you might ask yourself the following:
-
- Did you select the right sample?
- Do you need more users to be able to measure the effect of this change?
- Did you keep your test running for long enough? (Remember that depending on the metrics you are measuring you might need to run longer tests to see the effects—retention is a good example of this.) Remember also that you should always run your tests for X business cycles.
- Were there other external factors that might have affected your test?
Think also about the execution of the test:
-
- Were the changes between the test cells pronounced enough? Were they substantially differentiated? (Did you jump too quickly into testing details before you had established the basic concept?)
- Is there something upstream in the user flow that might have affected your results?
- Can you dig into your secondary metrics to see if there are any clues or differences in these metrics that might give you a hint as to what is going on?
At this point in time, you may want to investigate your secondary metrics: Remember that you shouldn’t base rollout decisions solely on secondary metrics, but they can be a good indicator to help you gain a more complete picture of why your result was flat: were there behaviors that counteracted the metric you were interested in? Did your test have no effect on any behavior at all?
For example, if you believe that your feature adds value because it’s something that users have been requesting, it is a simplification (or improvement) to the UI, or it has strategic value, then you might decide to roll it out. In these situations, the changes you are making have value beyond what you might be able to measure in metrics.
One example of this is when Spotify rolled out their new and unified dark interface. The new redesign did not affect retention.
In summary, you generally won’t roll out changes if you don’t see the impact you were hoping for. When you make changes to your experience, it has costs.
How do combat the costly effect of errors?
-Replication (if you can). Making sure that the data you get is similar to what you got before.
-Using secondary metrics:
-
- As a gut check on your key metrics
- To gather other insights or learning that build your knowledge base
Being able to see if secondary metrics moved along with primary metrics or if it was an isolated case.
Using different hypotheses:
-If we think about the multiple test cells, then perhaps a different hypothesis fits the data better
-Rolling out to more users
-Being able to see if the error rate can go down with additional sample size
Data triangulation and “Thick data”
-User stories, interviews, etc. from a smaller sample of the population
-Being able to see what and why people are doing things rather than the actions taken
Getting trustworthy data:
-Novelty effect (people perform better when excited about a new product)
-Seasonality bias (A/B Tests during Decemberr may be subject to holiday shopping)
Deciding how to roll out your experience, or not:
-Roll out to 100%: take one test experience and roll it out to entire audience. Do this when testing is successful and you feel like testing is mature enoguh.
-Roll out to a larger audience: Good feeling but don’t want to roll out all the way. Perhaps you’re running into errors, or some questions about broader audience and stuff.
Keep your existing experience: perhaps changes were not measurable or impactful to your audience enough.
Ask: What’s next from your designs?
-Were you exploring or evaluating?
-Do you keep learning or consider rolling out?
-Was your problem global or local?
-What part of the change resulted in the impact to metrics/audience?
-KNowing when to stop
-Have you optimized/iterated enough?
-Ramping up:
-What’s hte process like to roll out to 100%?
-Even if you’re ramping up, common process is to have holdback groups (5% with old interface) so that you don’t lose data from current experience.
-Secondary metrics may change/or other things may shift with new design.
-How do you communicate your change with audiences?
-If it’s global problem, then maybe you need to send out e-mail, etc.
-Evolving the design through iterative tests
-Again, how many times to iterate?
What if you still believe?
-Global testing may yield failures due to complexity. If you still believe hypothesis has merit, revisit a few categories (performance, limited choices in testing, loss of content, etc.)
Here are some questions you can ask yourself:
-
- Did you correctly identify the behavior you wanted to change? Was that behavior appropriately reflected in your metrics?
- Was your team (and your stakeholders) in agreement with what you were measuring and the success metrics that you selected?
- Did you craft a clear hypothesis that accurately reflected what you wanted to learn and what you predicted would happen?
- Were the experiences you designed differentiated enough to provide you with good learning? Were they impactful enough that you could measure and observe a change in behavior from your users?
- Were you too focused in your tests? Were you too broad?
- What was the impact of your designs on your user behavior? What did you do as a result, and why did you make that decision?
- On reviewing your data, is there something different you would do next time in designing your experiment?
Remember, there is no negative consequence of being “wrong.” In the end, asking these questions will help you will learn from “failed” tests as well as from the “successes.”
a
Chapter 7
Thursday, September 17, 2020
2:53 PM
In order to make the most of data-aware design, you have to also develop organization to a point where it’s accepted
Three principles to remember:
-
- A data-aware practice needs to be supported by a shared company culture that values understanding their users and continuous learning.
- Do you have depth and breadth?
- Communicating across hierarchy (Depth)
- -Is it the user or is it the HiPPO (Highest Paid Person’s Opinion) that is expressing an idea?
- What is a source of truth that doesn’t depend on factors like “I pay you, etc.”? Data
- Communicating across teams (Breadth)
- Do other teams like HR, Sales, etc. understand fundamentals of data-aware approach?
- Do you actively share data with other people?
- Is this a continuous learning environment?
- Keeping sharp on both theory and practice (especially as “best practices” around leveraging data evolve)
- Communicating across hierarchy (Depth)
- Do you have depth and breadth?
- A data-aware practice needs to be supported by a shared company culture that values understanding their users and continuous learning.
Leveraging lectures, brown bags, lunch and learns
Online courses
-
-
-
-
- Encouraging employees to be self-aware and evaluating their capabilities often
- Sharing results and information broadly
- Can you learn from your failures?
-
-
-
A failure isn’t a failure if you learn something from it
WHen you’re more comfortable failing (and learning from it), everything becomes better
-
-
-
-
- Keeping your “intuition” sharp
-
-
-
Working with data allows you to develop gut feelings about which hypotheses work and which don’t.
Keep your old hypotheses in your back pocket: context may change and as such those may become valuable
Context, business needs, or models may sometimes change.
-
- Hiring and growing the right people is essential to supporting data-aware processes and culture.
- Establishing a data-aware environment through your peers
- What does this mean? Does this stretch beyond testing? etc.
- Find and recruit “data friends” and allies: people who care about the data, and are willing to engage here
- Find a pilot project with well-defined success metrics and quick wins to showcase value to data-aware approach
- The best allies exist on other teams: not just your small group, but others who can advocate on your behalf
- HIring the right people with skills:
- Fundamental design skills
- A passion for driving businesses that are user-centered
- An affinity for understanding, generalizing, and being able to replicate design success and drive consistent user-centered design and product excellence
- A desire to engage with and learn about the scientific method and develop some skill or empathy for statistics and/or mathematics
- An ability to be open-minded, iterative, and engaged but not enslaved by initial design inspirations
- An ability to be very focused on results as well as production
- If you’ve been in a situation where you were confused, what did you do to correct that?
- Tell me about a situation where your team didn’t accomplish what they wanted to accomplish. What do you think was missing? What would you have done differently? How have you learned from that?
- Building the team with data involved from the start
- A transdisciplinary team, with different focuses, can be useful for tackling a problem vs just debating form different views
- Establishing a data-aware environment through your peers
- Hiring and growing the right people is essential to supporting data-aware processes and culture.
-
- Clear processes that help educate and align employees are needed to support a data-aware culture and values.
- How do you discuss, share, or evaluate data?
- Establish a knowledge baseline
- What’s the common ground
- What do people know about data analysis, capture, and consumption at your company?
- “If you were in charge of that, what would your hypothesis be?”
- Establish a common vocabulary
- HOw do we know “X”?
- HOw are we going to measure “Y?”
- We know that business slang reinforces one way of thinking, so why not use this approach for data-aware design?
- Develop a rhythm around data collection and sharing
- Having bi-weekly testing or set of data-sharing practices and formats
- Project review meetings
- Ongoing or upcoming work
- Results from launched projects
- Talking about what’s going on outside of your sphere can help introduce breadth
- What was hypothesis? Methodology? Success metrics? Design? Analysis? Concerns?
- Spreading data across organization
- Easiest way is tied with stories
- Clear processes that help educate and align employees are needed to support a data-aware culture and values.
Data doesn’t move people: stories do
-
-
-
-
- Personalized stories from data help to move the needle
- Creating a prescence at the office
-
-
-
showcasing work, data projects, etc. on white boards, post-its, shelves
-
-
-
-
- Looking at past projects
-
-
-
Reflecting on what you did right, wrong, what could be better, etc.
Conclusion:
-Think about ethics of collecting data as well
-
- Design always advocates for users and is accountable to users, and that good design brings with it a responsibility toward reflecting and addressing user needs through well-designed products and experiences.
- Design practice needs to be invested in representing users accurately and appropriately and that new methods are always needed to develop an understanding of users and user behaviors. Data is the new currency for business, and a new creative “mulch,” a fertile ground for design insights to be tested, inspired, developed, and extended. Experimentation and experimental data analysis can be an integral part of the design process. We believe that designers are, or should be, fundamentally interested in being disciplined about data and its collection, analysis, and use.
- A design perspective is needed to ensure that optimal user experiences are appropriately represented in business goals, measures, and metrics. Designers, user experience researchers, and data scientists are the perfect people to call out when metrics that concern users and usage do not make sense, when there is a gap between company vision and mission, and how that lands with everyday users. Understanding the gaps, verifying hunches and informal observations with data, can help you have influence on business metrics and business strategy.